- Modules
- Basic Concepts with Harmony Advanced
- Exposure Sheet, Timeline and Timing
Exposure Sheet, Timeline and Timing
T-PRIN-005-004
Animation is about movement and in order to have the illusion of movement, you need different drawings to progressively change over time. For your eyes to perceive a smooth motion and not just a series of drawings changing, you need several drawings per second. To be more precise, you need a minimum of 12 drawings per second. If you have less than 12 drawings per second, the motion will be jerky and you will not see a smooth motion.

It is important to know that the number of drawings per second will be based on the final output: television, cinema, web, DVD, etc., as those outputs have different frame per second rates. This parameter will influence the number of drawings per second as well as their exposure.
The exposure of a drawing is the length of time that it stays on the screen. A second can be divided as follows: 24, 25 or 30 images depending on the format. They are also called frames, so there are 24, 25 or 30 frames per second.
Broadcast Standards
There are two main broadcast standards used; the one selected will determine the frame rate.
In North America, Japan and other parts of Asia, the NTSC (National Television System Committee) format is used. This format is 30 images (frames) per second.
In most of Europe, PAL (Phase Alternating Line) format is the broadcast standard. This format is 25 frames per second.
Film format is 24 images per second.
The human brain is able to process an animation as slow as 12 drawings per second. Therefore, the number of frames per second should be between 12 and 30. The general standard is 24 or 25 frames per second, so these 12 drawings are set on double exposure. This means that each drawing stays on the screen for two frames. If a drawing is exposed for 24 frames, it means that it will appear to the eye for one second.
The timing is a drawing's exposure.
Exposure Sheet
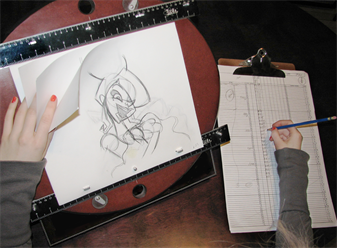
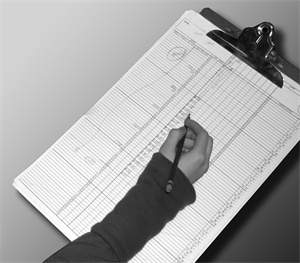
The exposure sheet, also known as the Xsheet or dope sheet, is used when an animator is planning a scene. The animator enters data in the different columns (layers), the name of the drawings and their exposure into the Xsheet.The Xsheet allows you to see the animation timing in detail.

The Xsheet is composed of columns corresponding to the different layers. Each column is split into rows representing the frames (images) in the scene. A paper Xsheet usually has 80 rows and ten columns. This enables the animator to associate a layer with a certain element (character, prop, mouth, etc.) and make a record of the frame at which each drawing appears.
The traditional paper Xsheet was mainly created for the animator to communicate with the cameraman regarding the scene's timing, the camera moves and element trajectories. It is still used today to express the same information to the compositors and the person working on the digital Xsheet.
Timeline
A traditional timeline is a horizontal and chronological representation of key events occurring within a particular historical period.

In the digital process, the timeline is quite similar. The timeline is read from left to right to help you understand the scene and its timing. The frames or timecodes are placed at the top and the elements or layers on the left. There is no drawing name or value information. The timeline displays the timing and elements in a simplified and systematic manner, making it easy to read globally. The timeline can be considered to be a quick overview of the whole scene.

Xsheet and Timeline Usage
Xsheets and timelines are used for different tasks. When a scene is done in a traditional animation workflow, the Xsheet is useful in keeping track of the drawings' ordering, names and timing. The Xsheet is used to reproduce the animator's work in the digital software or the camera. The colourists can then follow the Xsheet to paint the drawing sequences. Finally, the compositors can read the information that is necessary to their work from the Xsheet.
For digital animation, computer generated trajectories, hierarchies and distortions, there is a lot of extra information involved, including keyframes, velocities, function curves, and more. A keyframe is a computer-generated key position that contains values and coordinates for the element's onscreen positioning; keyframes can be displayed in the exposure sheet as values. If there are too many keyframes, modifying one can be difficult due to all of the values present. This is why there are digital timelines. Their simplified version of the timing is quite useful in these situations. The Timeline view does not display drawing names or keyframe values, but instead represents them as symbols, making it much easier for the eye to detect the desired element for modification. Although the name and value information is not directly displayed, the Xsheet is still very valuable when retrieving this type of information.
Time Estimated 15 mins
Difficulty Level Beginner
Topics List
- Introduction to Basic Concepts
- Frame Rate and Size
- Scenes
- Exposure Sheet, Timeline and Timing
- Bitmap and Vector Graphics
- Colour Palettes
- Line and Colour Layers
- Pegs
- Multiplane
- Content Organization